Climate Change in Maine
Climate change is different from the “weather.” Climate change observations and projections are based on “climate,” which are the long-term averages of weather observations across regional or global space.
As concentrations of greenhouse gases in the atmosphere cause warmer air temperatures worldwide, local changes are becoming evident. Specifically, Maine is experiencing warming air temperatures, increased rainfall, less snowfall, longer growing seasons, droughts and floods, shorter lake ice duration, heat stress, and enhanced species migration and extirpation.
These changes will continue to increase the incidence of Lyme disease, alter the maple syrup season, reduce moose populations, degrade water quality, foster pine needle blight, damage infrastructure, threaten winter recreational businesses, and generate uncertain farming conditions.
As these graphs from the US Climate Divisional Dataset illustrate, these trends have been building over the past 100 years.
(Click on graphs to enlarge)


All graphs are from Maine’s Climate Future (2020 Update)
local climate trends summary
As a result of human-induced climate change (i.e., our fossil fuel combustion), the Kezar Lake watershed is already experiencing a 1 °F and 8 °F increase in average and minimum annual air temperatures, respectively, a decrease in the number of extreme cold days (sub-zero), and a decrease in annual snowfall. Ice-out on Kezar Lake has been arriving earlier over the last several decades. Maine climate projections only show these trends worsening in the next century, which will impact the environmental, economic, and social well-being of the area.
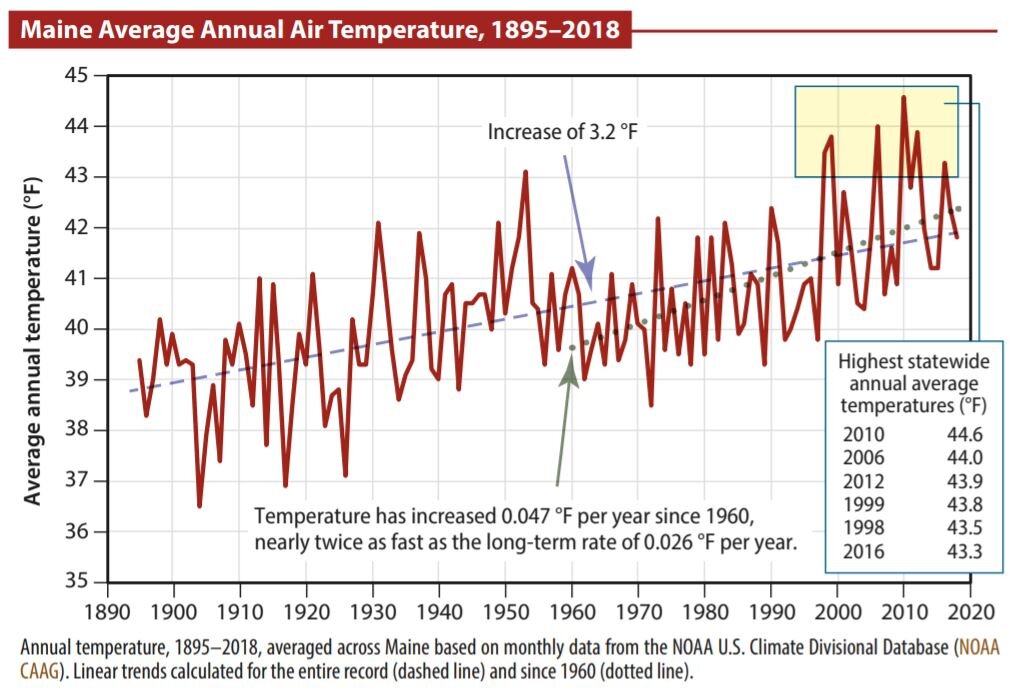
AiR temperature trends
Climate change is expected to increase global air temperatures, an effect that we have already observed in the last century. For example, the State of Maine has seen a 3.2 °F increase in annual air temperatures in the last century. Local weather observations may deviate from this general trend from season to season or year to year, depending on a suite of local variables. For the Kezar Lake watershed, we used the North Conway weather station to track changes in air temperature since 1959.
Annual Air Temperature in North Conway, NH
We are experiencing 8 °F warming in minimum air temperatures and 1 °F warming in average air temperatures since 1959.
Extreme Heat Days in North Conway, NH
We are not experiencing any significant trends in extreme heat days due to year-to-year variability. The northeast will likely not experience as dramatic an increase in extreme heat days as other parts of the country.
Extreme Cold Days in North Conway, NH
We are experiencing about 20 less extreme cold days below 0°F each year compared to 1959. Winters are warming faster than summers.
precipitation trends
Warming air temperatures have impacted rain and snow patterns across the globe. In Maine, total annual precipitation has increased by 5.8 inches (15%) since 1895. Snowpack duration has decreased by two weeks since 1895 across Maine. For the Kezar Lake watershed, we used the North Conway weather station to track changes in precipitation since 1959.
Annual Precipitation in North Conway, NH
Annual precipitation has been highly variable since 1959 with no discernible patterns.
One inch precipitation events in North Conway, NH
The number of days per year with greater than 1 inch of precipitation has increased by approximately two days.
Wettest Day of Year in North Conway, NH
The amount of precipitation on the wettest day each year has been highly variable since 1959 with no discernible patterns.
Snowfall Accumulation in North Conway, NH
We are experiencing about 30 inches less of annual snowfall accumulation since 1959.
ice out trends
Ice-out data has been collected for Kezar Lake since 1901, providing over a century of information about changes in the seasonal duration of winter snowpack and ice. Ice-out refers to the day when all ice covering Kezar Lake has broken up and melted. This marks the beginning of spring when the entire lake is exposed to direct sunlight, which stimulates lake productivity and drives the critical process of spring turnover.
Kezar Lake Ice-Out Dates
Annual ice-out dates have been highly variable since 1901, but show a possible earlier ice-out trend in the last few decades. Refer to Ice-In/Ice-Out Records under Other Reports for the raw data.
(All data for the above air temperature and precipitation graphs were taken from the NOAA National Climatic Data Center for station CONWAY 1 N, NH US (ID# GHCND:USC00271732) for 1959-73 and station NORTH CONWAY, NH US (ID#GHCND:USC00275995). Mann-Kendall trend tests were performed on datasets with 10 or more years of data. Statically-significant trends are shown as dotted trend lines.)
AIR pollutant trends
Burning Fuels Causing a Warming Planet
We rely on the burning of fossil fuels (i.e., gasoline, coal, and natural gas) for nearly all aspects of our everyday lives. This heightened energy demand for and use of these finite resources over the last century has introduced an excess of noxious gases to the atmosphere. Some of these gases (e.g., carbon dioxide, methane, and nitrous oxide), also known as greenhouse gases, are responsible for trapping reflected heat from the earth’s surface. This process is vital to maintaining a habitable planet, but excess greenhouse gases in the atmosphere enhances this effect by trapping more heat and increasing air temperatures globally. Warmer air temperatures impact rain and snow patterns, sea level rise, and species migrations.
Acid Rain Impact on Kezar Lake Watershed
Fossil fuel combustion also emits sulfur dioxide and nitrogen oxides to the atmosphere. These gases react with water vapor, oxygen, and other gases in the atmosphere to form sulfuric and nitric acids, which fall on water and land surfaces as acid rain. Acid rain lowers the pH of aquatic and terrestrial systems, causing reduced reproductive capacity of sensitive aquatic organisms, lower body weight of fish, decreased species diversity, and forest mortality.
Substantial effort was made to reduce acid rain deposition through the 1970 Clean Air Act, which established national ambient air quality standards for controlling these noxious emissions. While emissions have decreased and the damaging short-term effects of acid rain have been minimized, many waterbodies are still recovering from the long-term effects of acidification.
In particular, parts of the northeastern United States have thin soils with granite geology that lack carbonates, a key component of a system’s buffering capacity or ability to neutralize acidic compounds. We see this in streams of the Kezar Lake watershed where low-pH rain (5.0) temporarily decreases the pH of surface waters. These swings in pH create stressful environments for sensitive aquatic organisms.
Greenhouse Gas Emissions
According to the Eighth Biennial Report on Progress Toward Greenhouse Gas Reduction Goals (2020), Maine’s carbon dioxide emissions have remained 10% lower than 1990 levels due to the use of lower carbon-generating fuels such as natural gas, use of renewables, and better efficiency standards. Nearly 75% of Maine’s electricity already comes from renewables and should increase with the passing of legislation in 2019 that incentivizes growth of solar power in Maine.
Under the direction of Governor Janet Mills, the Maine Climate Council is tasked with devising policy strategies for meeting greenhouse gas emission targets of 45% reduction by 2030 and 80% reduction by 2050. An updated Climate Action Plan is scheduled for release by December 2020.
For Maine,transportation is the largest source of greenhouse gas emissions at 53%, compared to industry (10%), commercial (10%), residential (18%), and electric power (9%). Within transportation, most emissions come from personal vehicles rather than air, rail, shipping, or marine traffic. Some proposed solutions include setting auto fuel efficiency standards, encouraging and investing in electric vehicles, and expanding public transit range and options. Other initiatives are described here.
Atmospheric concentrations of greenhouse gases (such as carbon dioxide, methane, and nitrous oxide) have increased over the last several hundred years to record highs as a result of human-driven burning of fossil fuels. These concentrations are unprecedented in the available record for the last 800,000 years. Data through 2015 were obtained from a variety of sources and studies compiled by the EPA. Data from 2016 to present were obtained from the Mauna Loa, Hawaii station through NOAA’s Earth System Research Laboratory Global Monitoring Division.
projections
Maine can expect an additional 3.0-5.0 °F increase in annual air temperatures by 2050; these temperature increases will largely occur in winter and will lengthen the growing season by an additional 2 weeks.
Western Maine will experience an increase of 2.5 to 6.5 days when the heat index is greater than or equal to 95 °F by 2050.
Precipitation in western Maine will increase 5-6% by 2050, most of which will fall in summer and fall.
Maine will experience more frequent and intense storm events (defined as greater than 2” of rain within 24 hours). This is indirectly linked to changes in sea surface temperature in the North Atlantic and melting sea ice in the Arctic.
Western Maine, will experience a 20-40% decline in annual snowfall by 2054. Just as the growing season is predicted to increase by 2 weeks, so the duration of snowpack will decrease by 2 weeks by 2050.
It is very likely that while total snowfall will decline, snow that does fall will likely occur as extreme events (e.g., Nor’easters) with significant accumulations in a few, single events.
references
Boeck, M., Jackson, R., and H. Shaftel. Global Climate Change Temperature. NASA. July 28, 2015. http://climate.nasa.gov/interactives/climate-time-machine
Fernandez, I., S. Birkel, C. Schmitt, J. Simonson, B. Lyon, A. Pershing, E. Stancioff, G. Jacobson, and P. Mayewski. 2020. Maine’s Climate Future 2020 Update. Orono, ME: University of Maine. Available online at: www.climatechange.umaine.edu/wp-content/uploads/sites/439/2020/02/Maines-Climate-Future-2020-Update-3.pdf
Fernandez, I.J., C.V. Schmitt, S.D. Birkel, E. Stancioff, A.J. Pershing, J.T. Kelley, J.A. Runge, G.L. Jacobson, and P.A. Mayewski. “Maine’s Climate Future: 2015 Update.” Orono, ME: University of Maine (2015): 24 pp. www.climatechange.umaine.edu/research/publications/climate-future
Horton, R., G. Yohe, W. Easterling, R. Kates, M. Ruth, E. Sussman, A. Whelchel, D. Wolfe, and F. Lipschultz, 2014: Ch. 16: Northeast. Climate Change Impacts in the United States: The Third National Climate Assessment, J. M. Melillo, Terese (T.C.) Richmond, and G. W. Yohe, Eds., U.S. Global Change Research Program, 16-1-nn. http://nca2014.globalchange.gov/report/regions/northeast
Hodgkins, Glenn A., Ivan C. James, and Thomas G. Huntington. “Historical changes in lake ice‐out dates as indicators of climate change in New England, 1850–2000.” International Journal of Climatology 22.15 (2002): 1819-1827.
IPCC [Core Writing Team, R.K. Pachauri and L.A. Meyer (eds.)]. “Climate Change 2014: Synthesis Report. Contribution of Working Groups I, II and III to the Fifth Assessment Report of the Intergovernmental Panel on Climate Change.” IPCC, Geneva, Switzerland: (2014): 151. http://www.ipcc.ch/pdf/assessment-report/ar5/syr/SYR_AR5_FINAL_full.pdf
NOAA. Monthly Summaries of the Global Historical Climatology Network – Daily (GHCN-D). COOP:275995 & 271732. NOAA National Climatic Data Center. July 21, 2015.